Drawing a log(P)-h Diagram
Contents
Drawing a log(P)-h Diagram#
CoolProp has built-in functionality to draw the log(P)-h diagram of a refrigerant, together with some means to draw a simple vapor compression cycle on this diagram. Based on CoolProp’s functionality a small wrapper class LogPhDiagram in package hvac.charts has been developed to draw the log(P)-h diagram of a refrigerant quickly.
from hvac import Quantity
from hvac.fluids import Fluid
from hvac.charts import StandardVaporCompressionCycle, LogPhDiagram
Q_ = Quantity
Drawing an Empty log(P)-h Diagram#
First we need a refrigerant. Let’s take R410A for example:
R410A = Fluid('R410A')
To create the log(P)-h diagram for R410A and show it, the code below will do it:
R410A_diagram1 = LogPhDiagram(R410A, size=(8, 6), dpi=96)

# hide the header and footer of the figure
R410A_diagram1.figure.canvas.header_visible = False
R410A_diagram1.figure.canvas.footer_visible = False

R410A_diagram1.show()

Drawing a Standard Vapor Compression Cycle on the log(P)-h Diagram#
A standard vapor compression cycle is described by:
the refrigerant
the evaporation temperature
the condensation temperature
the degree of superheat of the refrigerant vapor at the exit of the evaporator (useful superheat)
any additional superheating of the refrigerant vapor in the suction line between the evaporator outlet and the compressor inlet
the degree of subcooling of the refrigerant liquid at the exit of the condenser or the entrance of the expansion device
the isentropic efficiency of the compressor
For example let’s consider the following standard vapor compression cycle:
refrigerant: R410A
evaporation temperature: 5 °C
useful superheat: 10 K
additional superheat: None
condensation temperature: 50 °C
subcooling: 10 K
isentropic efficiency: 73.88 %
We need first to create an instance of class StandardVaporCompressionCycle with the data from above:
cycle_R410A_1 = StandardVaporCompressionCycle(
    Refrigerant=R410A,
    evaporationTemperature=Q_(5, 'degC'),
    condensationTemperature=Q_(50, 'degC'),
    evaporatorSuperheat=Q_(10, 'K'),
    subCooling=Q_(10, 'K'),
    suctionLineSuperheat=None,
    isentropicEfficiency=Q_(73.88, 'pct')
)
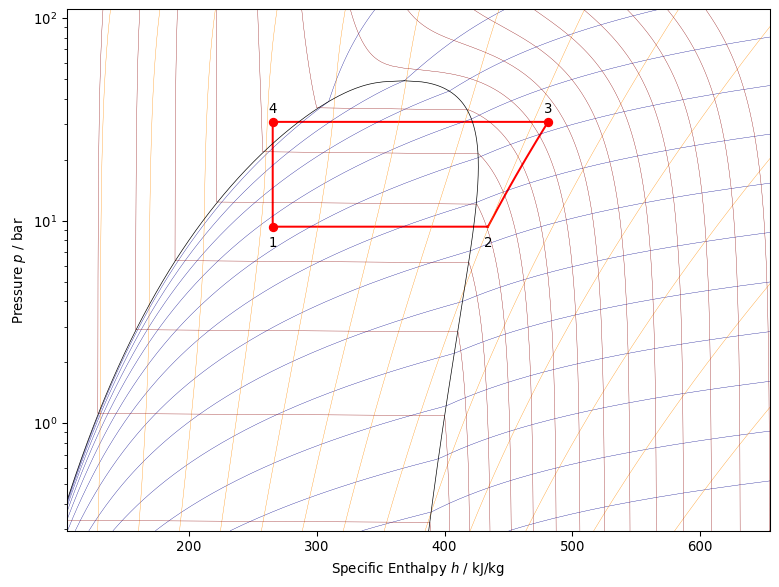
Next, we instantiate class LogPhDiagram passing in the cycle we’ve just created and call show() on the diagram:
R410A_diagram2 = LogPhDiagram(R410A, size=(8, 6), dpi=96)
R410A_diagram2.setCycle(cycle_R410A_1)
R410A_diagram2.show()


